How machine monitoring solutions can create perfect harmony between customers, OEMs, and vendors

We conducted short interviews with leaders from different OEMs to understand the challenges they faced. Part of the exercise was to understand what changes OEMs could incorporate to improve their operations and revenue. These were some common points compiled:
- “The major challenge for us is to avoid service disruptions for our clients.”
- “For now, the maintenance strategies for the products we provide have been manual. We’ll need to come up with better ways.”
- “We spend a lot of time going back and forth between customers and our vendors as part of maintenance activities. It’s not streamlined.”
- “We either end up overstocking or understocking spare parts and that causes delays throughout the supply chain.”
- “There is no scope for real-time insights. We’re relying on 10s of different Excel sheets for information. It gets cumbersome.”
All these challenges stem from a lack of a proper maintenance strategy; it seems to be hinged more on manual data entry and analysis and intuition than on a more practical approach. An approach that readily addresses problems before they occur rather than trying to fix them after, i.e., proactive over-reactive.
Why proactive over reactive? A study through an example
Let’s look at an example to understand exactly what the two terms entail. The blast furnace is a primary component of the steel mill, where it converts iron ore, coke, and limestone into molten iron. This molten iron will then be used as a raw material in the production of steel. The components of this blast furnace include:
- Furnace shell
- Refractory lining
- Tuyeres
- Stoves
- Dust and gas handling systems
- Customer–Here, the company that owns the steel mill
- OEM–The company contracted to manufacture components for the blast furnace
- Vendor–A third-party company contracted by the OEM to provide routine maintenance, supply spare parts, conduct inspections, and other activities.
Let’s go through the example below to understand the two scenarios in depth, looking at them through the lenses of the customer, OEM, and vendors.
Case 1: OEM employs reactive maintenance of the blast furnace in the steel mill
In this scenario, the OEM follows a time-based maintenance strategy that involves scheduled inspections and servicing of machines at predefined intervals. Though this technique is better than a run-to-failure maintenance strategy—where a machine is repaired only after it breaks down—it falls short in situations where the machine tends to break down between maintenance periods. For instance, the OEM contracts a vendor to carry out periodic maintenance (every six months) to clean and inspect the tuyeres in the blast furnace. During one such maintenance, the technicians find the tuyeres in normal working condition, without any blockages or issues. After three months of this maintenance, one of the tuyeres becomes partially blocked by slag. This results in a performance reduction in the blast furnace and subsequently a lower quality of molten iron. The customer then is forced to halt all activities and contact the OEM for an emergency maintenance activity.
The OEM also relies on manual record-keeping and paper-based systems to monitor the working of the blast furnace. This includes using physical logbooks to note temperature readings, prepare inspection reports, and write down observations. The analysis relies on manual observation and intuition, in this case.
Let’s look at how a reactive maintenance strategy affects the three parties:
Customer
Unplanned shutdowns: As you saw above, an unplanned shutdown can result in disruption to the workflow. The time between shutting down and starting a production process can be anywhere between 5-15 days based on the severity of the issue.
Operational inefficiency: Due to the blast furnace being shut down abruptly, there is a sharp increase in operational costs. In some situations, pieces of equipment or parts of the setup may have to be replaced entirely, resulting in an astronomical increase in costs. One such instance is the continuous wear and tear of refractory bricks, which when not monitored regularly, can become severely damaged and might have to be replaced entirely.
Delays in order fulfillment: The steel mill has to postpone orders to a later date because of untimely maintenance activity.
OEM
High service costs: Based on the severity of the issue in the blast furnace, the OEM might have to incur losses as they contract the vendor to carry out the maintenance activity at a higher cost than usual.
Loss of trust and reputation: Repeated occurrences of failures can cause the steel mill to lose trust in OEM’s products and subsequently end the contract.
Lack of opportunity to explore additional revenue streams: OEMs can increase their revenue were they to provide a solution that focuses on proactive maintenance, data-driven insights, and real-time machine monitoring.
Vendor
Unpredictable workload: Unscheduled maintenance issues can cause disruptions to technicians’s work schedules.
Higher maintenance costs: Performing unscheduled maintenance might involve the vendor sourcing material (machine components, new parts, etc.) for a higher cost.
Un-optimized spare parts inventory management: There is no scope for optimizing inventory levels for spare parts such as cooling system components, gas cleaning equipment, pipes and ducts, liners, and other equipment necessary for the smooth functioning of a blast furnace.
Let’s not forget that the OEM relies on manual data entry and record-keeping for its maintenance activities. This can introduce additional problems such as missing information, irregular updates, and lack of visibility on maintenance activities. This means there is no proper record of:
- Spare parts used in previous maintenance activities
- Commonly occurring problems in the furnace as noted by technicians assigned to previous breakdowns
- Resource allocation details such as labor, equipment, and maintenance schedules
Also, notice a lack of visibility in the entire process between the three parties. The issues can include:
- Each party stores data and records (assuming they feed manual records into Excel systems) in isolation. Data stored in silos creates barriers to information sharing.
- There is no clear communication between the parties on maintenance needs, schedules, and spare part requirements. For example, the customer (here, the steel mill company) might not have visibility into the maintenance process or the vendor may not have real-time information on the machine's condition.
- The information that each party at a given point has may vary as there is no real-time update due to delays in updating records across all systems manually
We have seen how a traditional, reaction-based maintenance culture can introduce several problems in service management, process optimization, and documentation. Let’s now look at how most of these limitations can be addressed by switching to a proactive maintenance strategy.
Case 2: OEM employs proactive/predictive maintenance of the blast furnace in the steel mill
In the second scenario, the OEM follows a proactive maintenance strategy as part of service management. A smart machine monitoring platform is integral to a proactive maintenance strategy.
What exactly is this and how can it help address most of the previously seen challenges?
Machine monitoring systems, commonly referred to as machine monitoring platforms for industrial automation, are AI-powered solutions that are responsible for monitoring a machine or “listening” to it. This “listening” is made possible through the use of sensors, IoT devices, or SCADA systems that continuously output data to a central system from which the machine monitoring solution takes the input. This helps track machine health, usage, and external environmental conditions.
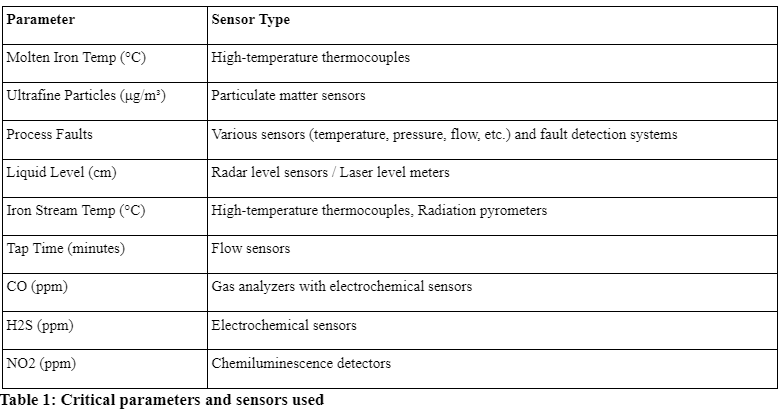
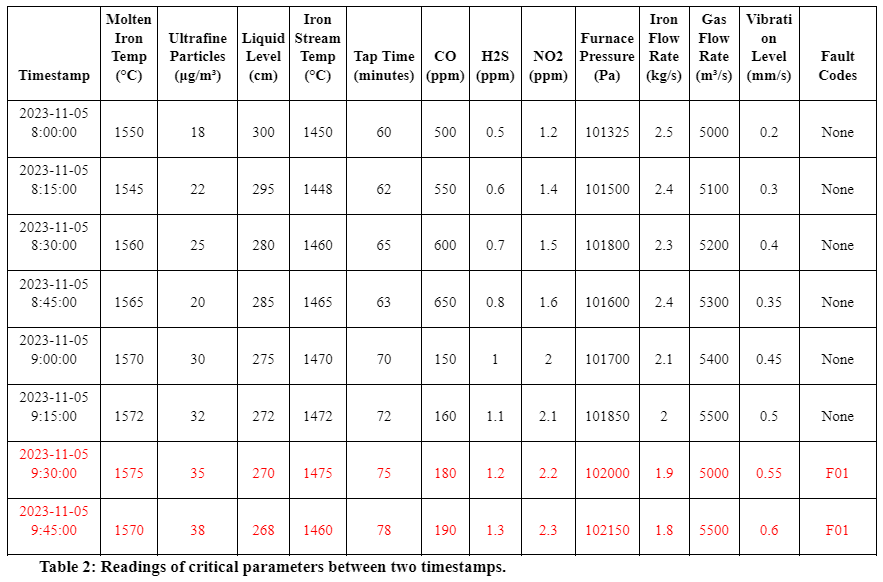
Let’s take the example of the blast furnace. The blast furnace is fit with sensors to track critical parameters (this is often decided according to domain knowledge) that may affect its performance over time. The sensors capture readings periodically (every 30 seconds, 1 minute, or a custom time interval) and store this data on a centralized server from which the machine monitoring system can read. Table 1 lists the critical parameters being monitored through a set of sensors and Table 2 has readings of these parameters between two time intervals. Table 3 contains the recent services provided as part of the strategy.
The OEM configures the machine monitoring software to track critical parameters in real-time. Based on pre-defined thresholds, the software sends out alerts and notifies the technical team in the event of abnormalities or deviations from normal working conditions. The extent of deviation is decided by experts. For instance, setting the threshold very close to the operational limit may cause the machine to send out alerts even with minor deviations in the data.
In some cases, the deterioration in the blast furnaces’ operation may be due to a combined set of variables with different thresholds. This makes it difficult to establish a relationship between the variables and the failure. In such a case, it becomes necessary to use a custom ML model that can predict the likelihood of failure based on the data it receives. For example, in Table 2, you can see that only a subset of variables, namely Ultrafine Particles, CO (ppm), Furnace Pressure (Pa), and Vibration Level (mm/s) may indicate a potential issue in the blast furnace. Therefore, this is denoted by a fault code “F01”. Based on the logic defined, the team may wait for a longer period before deciding whether they want to conduct an inspection of the blast furnace. For instance, they may wait for a period of 5 hours to observe if the model prediction is consistent, i.e. “F01” before taking action. There can be different error codes based on the type of issue and its severity.
The ML model in the above case is trained on historical data (generally 9 months to 1 year) so it can discover patterns between the parameters tracked and the potential problems in the blast furnace. Once trained on the historical data, the model then predicts how likely a problem might occur for newer datasets (for instance, data being read in real-time). This is an example of predictive analytics where the model is able to predict future outcomes based on current data. This makes it possible for the maintenance team—in collaboration with the vendor—to design smart maintenance strategies that focus on addressing a potential problem before it escalates. The same logic is extensible for process optimization. After discovering the variables which, when maintained within a fixed range, result in better yield, the entire setup can be configured to allow for it. For example:
- Molten Iron Temperature: 1450 - 1550 °C
- Ultrafine Particles: < 30 μg/m³
- Liquid Level: 280 - 320 cm
- Iron Stream Temperature: 1400 - 1500 °C
- Tap Time: 45 - 75 minutes
- CO: < 100 ppm
- H2S: < 1 ppm
- NO2: < 2 ppm
The steel mill can implement automated control systems to maintain the variables within the above ranges.
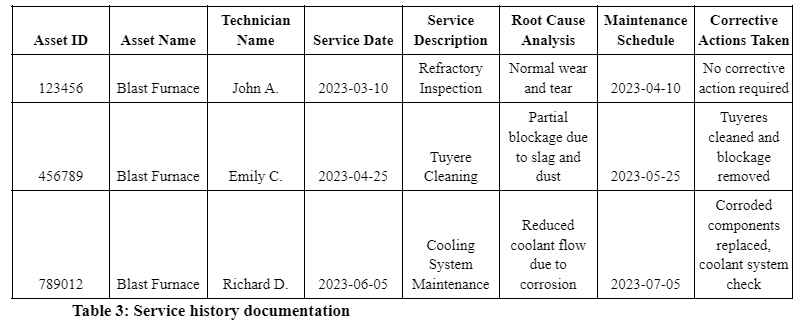
The machine monitoring solution can also be configured to automatically generate maintenance reports containing details such as asset ID, asset name, technician information, root cause analysis, and maintenance schedules. You can see an example in Table 3. This is now accessible by all three parties at any given point in time.
Detailed service documentation also makes it possible to optimize resource allocation, work order management, and vendor management using service history documentation. With enough data, the steel mill’s finance team can also develop models to predict future costs associated with different maintenance activities and allocate the budget effectively. A similar estimation can be conducted by the OEM and the vendor to help in pricing. Not only this, vendors can now optimize their inventory levels to avoid scenarios of overstocking or understocking.
Let’s summarize what a proactive maintenance strategy, powered by a machine monitoring solution, would look like for the three parties:
Customer
- Lower downtime: The steel mill has fewer downtime periods. With minimal disruption to the process, the time-to-market has improved.
- Improved trust: With faster deliveries and expedited supply chain operations, there is an increase in customer satisfaction and trust.
- Increased revenue and lower operational costs: Proactive maintenance reduces unexpected breakdowns and prevents additional costs due to machine failure. This results in an increase in revenue.
OEM
- Proactive engagement: OEMs offer predictive maintenance services and advanced insights to steel mill operators, enabling smart maintenance planning and data-driven decision-making.
- Additional revenue streams: By providing quality, add-on services, OEMs can have diversified revenue streams. This can include access to process optimization initiatives, energy optimization, data analytics and insights, and other add-on services offered as subscription-based services.
- Improved work order management: By referring to service documentation history, OEMs can better allocate resources and manage vendors, while providing services to multiple clients.
Vendor
- Efficient scheduling: With proactive maintenance, vendors have a clear picture of the workload and the timelines. This helps them optimize resource allocation so that technicians do not feel overburdened.
- Improved inventory planning: With complete visibility into the customer’s machine's health and potential issues, vendors can stock spare parts in advance. Maintaining optimal inventory levels helps reduce costs in the long run.
We’ve seen how the introduction of a machine monitoring solution can empower organizations to switch from reactive to proactive maintenance. Smart machine maintenance or process optimization is only a small aspect of this transition. Over time, this can foster collaboration amongst different teams (across all three parties), encouraging a culture of trust and transparency. A win-win for all the participants.
Let’s also have a look at two important factors that tie back to maintenance management for all the participants: ROI and Customer Experience.
Example of improved ROI with the help of predictive maintenance
The best way to measure the ROI would be the use Overall Equipment Effectiveness (OEE) for the blast furnace in a steel mill. To calculate OEE, we’d need three variables:
- Availability: Here, we’d measure how often the blast furnace is available for production against the planned production time.
- Performance: This variable measures how efficient the process is, i.e. percentage of output compared to the maximum output possible. Let’s say if the furnace operates at 95% of its maximum capacity, the performance rate is 0.95.
- Quality: This refers to the quality of output produced, i.e. the quality of molten iron produced. Take the hypothetical scenario where 98% of the molten iron produced meets quality standards, so in this case, the quality rate would be 0.98.
Without proactive maintenance
- Planned Production Time: 20 hours
- Availability: The furnace operates for 14 hours due to maintenance and breakdowns, i.e. 14 hours / 20 hours = 0.7 or 70%
- Performance: The furnace runs at 90% of its ideal capacity. Quality: 85% of the produced molten iron is of the desired quality.
OEE = Availability × Performance × Quality
= 0.7 * 0.9 * 0.85
= 0.5355 or 53.55%
With proactive maintenance
New Availability: 18 hours / 20 hours = 0.9 or 90% (This is because we’re using a machine monitoring solution that enables real-time monitoring and predictive maintenance therefore increasing the availability)
For simplicity, let’s keep the other variables the same, i.e. performance would be 90% and quality would be 80%.
New OEE = 0.9 * 0.9 * 0.85
= 0.6885 or 68.85%
This improved OEE suggests that the furnace's effectiveness has increased to 68.85%.
Let’s assume the following based on current rates:
The furnace processes 100 tons of iron ore per hour at full capacity and the sale value per ton of processed iron ore is $150.
Financial impact
Financial Impact Without Proactive Maintenance- Initial OEE: 53.55%
- Planned Production Time: 20 hours
- Effective Operating Time (OEE × Planned Production Time): 0.5355 × 20 hours = 10.71 hours
- Daily Output (Effective Operating Time × Full Capacity Output): 10.71 hours × 100 tons/hour = 1,071 tons
- Daily Revenue: 1,071 tons × $150/ton = $160,650
- New OEE: 68.85%
- Planned Production Time: 20 hours
- Effective Operating Time (OEE × Planned Production Time): 0.6885 × 20 hours = 13.77 hours
- Daily Output: 13.77 hours × 100 tons/hour = 1,377 tons
- Daily Revenue: 1,377 tons × $150/ton = $206,550
Increase in Daily Revenue = $206,550 (with proactive maintenance) - $160,650 (without proactive maintenance) = $45,900
This means there’s going to be an annual increase of $16,753,500 if we assume that the furnace operates all 365 days.
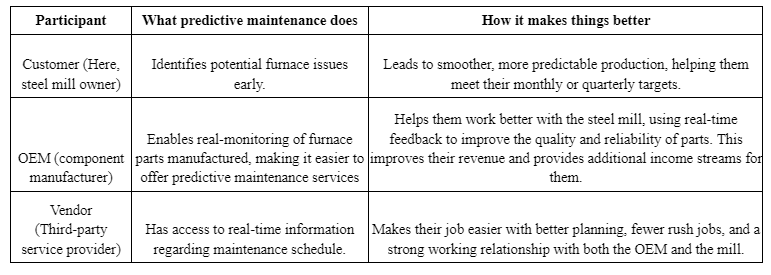
Example of improved customer experience through predictive maintenance
Here’s a table that summarizes how the use of proactive/predictive maintenance leads to improved customer experience across all parties:
CTA
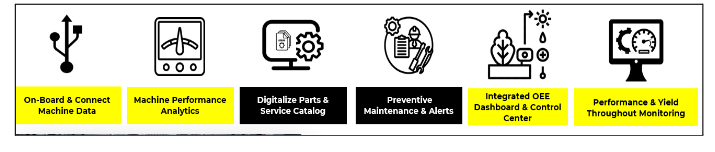
Rawcubes offers iDataOps, a machine monitoring platform, for easy integration with manufacturing equipment to make a truly smart manufacturing facility.
 Why iDataOps?
- Machine onboarding and digital cataloging: iDataOps helps to onboard the required machines onto the platform as unique assets and to label them by their name, serial number, type, parameters tracked, and notification settings. This enables real-time tracking of each machine separately.
- Automated data collection: iDataOps collects data from machine sensors, IoT devices, SCADA systems, and other external devices to get a continuous stream of data to assess machine health and usage.
- Data unification: It unifies the heterogeneous data into a single, cohesive dataset for continuous analysis and monitoring.
- Real-time monitoring: iDataOps tracks important metrics such as Remaining Useful Life (RUL), Mean Time To Failure (MTTF), cycle time, defect rate, and machine downtime to assist in efficiency optimization and maintenance scheduling.
- Finding anomalies and deviations: Powered with AI, iDataOps can help determine if there is a deviation in the asset’s ideal working conditions.
- Alert configuration: When the pre-defined threshold is reached, iDataOps generates automated alerts and notifications, prompting maintenance personnel to act.
- Automated service history documentation: It generates a service document (based on the customized template) that lists the assets, the dates and types of maintenance activities performed on each asset, the metrics collected during each maintenance activity, root cause analysis, and the corrective actions taken to address the issues.
- Dashboarding: iDataOps provides detailed interactive dashboards for machine health monitoring, maintenance schedules, energy consumption, and historical data. You can also create custom dashboards based on your requirements.
In short, iDataOps helps establish perfect harmony between your customers and vendors, streamlining service management between all three parties.
iDataOps’ track record:
- $1M year-on-year savings with services and product engagement
- 20% increase in throughput/uptime with real-time visibility across the factory floor
- 80% of manual data analysis was reduced with lower dependency on data teams
Contact Rawcubes today to discover how iDataOps can help you transition from a reactive to a proactive culture and empower your maintenance teams to tackle new challenges in the industry while we help manage your day-to-day activities!